
import torch
import matplotlib.pyplot as plt
import seaborn as sns
%matplotlib inline
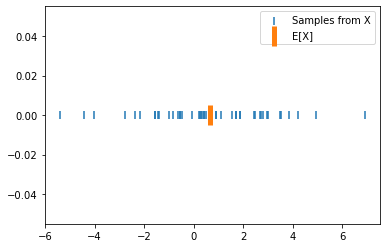
X_rv = torch.distributions.Normal(loc = 1., scale = 3.)
X_samples = X_rv.sample([50])
plt.scatter(X_samples, torch.zeros_like(X_samples), marker = '|', label='Samples from X', s = 50)
plt.scatter(X_samples.mean(), torch.zeros(1), marker = '|', s = 400, label='E[X]', lw = 5)

plt.legend()
<matplotlib.legend.Legend at 0x146514e50>
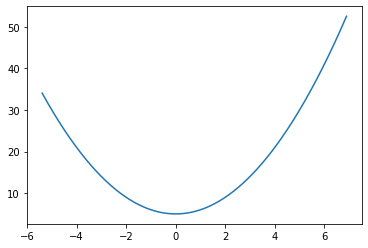
f = lambda x: x**2 + 5
x_lin = torch.linspace(X_samples.min(),X_samples.max(), 1000)
plt.plot(x_lin, f(x_lin))
[<matplotlib.lines.Line2D at 0x14658b610>]
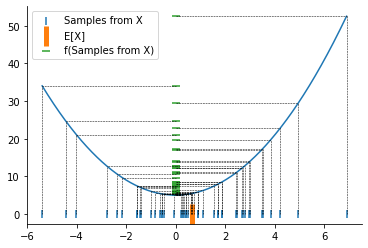
plt.scatter(X_samples, torch.zeros_like(X_samples), marker = '|', label='Samples from X', s = 50)
plt.scatter(X_samples.mean(), torch.zeros(1), marker = '|', s = 400, label='E[X]', lw = 5)
plt.plot(x_lin, f(x_lin))
plt.scatter(torch.zeros_like(X_samples), f(X_samples), label='f(Samples from X)', marker='_', s = 50)
for i, (point_x, f_point_y) in enumerate(zip(X_samples, f(X_samples))):
    plt.plot([point_x, point_x], [0, f_point_y], linestyle='--', color='k', lw = 0.5)
    plt.plot([0, point_x], [f_point_y, f_point_y], linestyle='--', color='k', lw = 0.5)

plt.legend()
sns.despine()
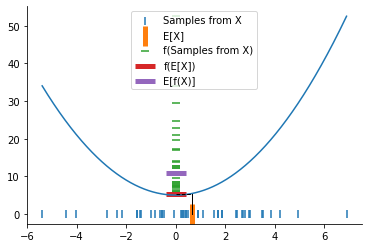
plt.scatter(X_samples, torch.zeros_like(X_samples), marker = '|', label='Samples from X', s = 50)
plt.scatter(X_samples.mean(), torch.zeros(1), marker = '|', s = 400, label='E[X]', lw = 5)
plt.plot(x_lin, f(x_lin))
plt.scatter(torch.zeros_like(X_samples), f(X_samples), label='f(Samples from X)', marker='_', s = 50)

plt.plot([0, X_samples.mean()], [f(X_samples.mean()), f(X_samples.mean())], linestyle='--', color='k', lw = 1)
plt.plot([X_samples.mean(), X_samples.mean()], [0, f(X_samples.mean())], linestyle='-', color='k', lw = 1)

plt.scatter(torch.zeros(1), f(X_samples.mean()), marker = '_', s = 400, label='f(E[X])', lw = 5)

plt.scatter(torch.zeros(1), f(X_samples).mean(), marker = '_', s = 400, label='E[f(X)]', lw = 5)


plt.legend()
sns.despine()
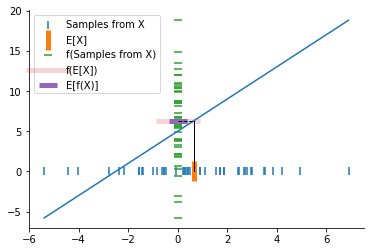
If f was linear
f = lambda x: 2*x + 5

plt.scatter(X_samples, torch.zeros_like(X_samples), marker = '|', label='Samples from X', s = 50)
plt.scatter(X_samples.mean(), torch.zeros(1), marker = '|', s = 400, label='E[X]', lw = 5)
plt.plot(x_lin, f(x_lin))
plt.scatter(torch.zeros_like(X_samples), f(X_samples), label='f(Samples from X)', marker='_', s = 50)

plt.plot([0, X_samples.mean()], [f(X_samples.mean()), f(X_samples.mean())], linestyle='--', color='k', lw = 1)
plt.plot([X_samples.mean(), X_samples.mean()], [0, f(X_samples.mean())], linestyle='-', color='k', lw = 1)

plt.scatter(torch.zeros(1), f(X_samples.mean()), marker = '_', s = 2000, label='f(E[X])', lw = 5, alpha=0.2)

plt.scatter(torch.zeros(1), f(X_samples).mean(), marker = '_', s = 300, label='E[f(X)]', lw = 5)


plt.legend()
sns.despine()
References