Stationarity of time-series stochastic process#
Author: Zeel B Patel
Main resources used:
How to Check if Time Series Data is Stationary with Python - machinelearningmastery.com
Time Series Analysis in Python – A Comprehensive Guide with Examples
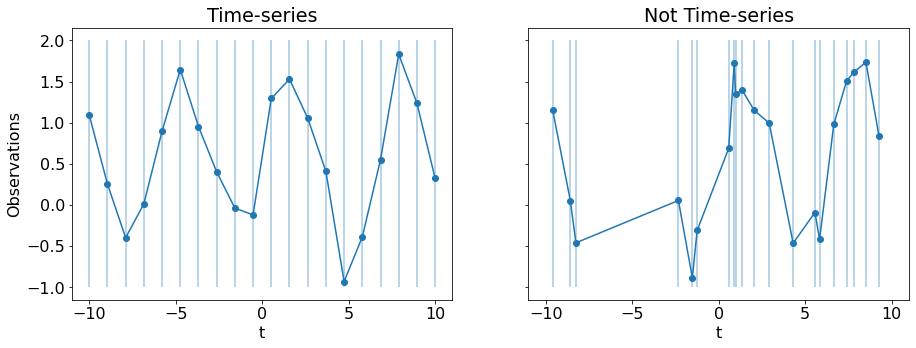
What is a time-series?#
Observations made at equally spaced time-stamps create a time-series
import numpy as np
import matplotlib.pyplot as plt
from matplotlib import rc
from GPy.kern import RBF, Matern32, Matern52, Exponential, ExpQuad
N = 20
l,h=-10,10
np.random.seed(0)
xs = np.linspace(l,h,N)
ys = np.sin(xs) + np.random.rand(N)
np.random.seed(0)
xns = np.sort(np.random.uniform(l,h,N))
yns = np.sin(xns) + np.random.rand(N)

rc('font', size=16)
# rc('text', usetex=True)
fig, ax = plt.subplots(1,2,sharey=True,sharex=True, figsize=(15,5))
ax[0].plot(xs, ys,'o-')
for i in range(N):
    ax[0].vlines(xs[i], -1, 2, alpha=0.4)
    ax[1].vlines(xns[i],-1, 2, alpha=0.4)
ax[1].plot(xns, yns, 'o-');
ax[0].set_xlabel('t');ax[1].set_xlabel('t');
ax[0].set_ylabel('Observations');

ax[0].set_title('Time-series')
ax[1].set_title('Not Time-series');
What is a stochastic process?#
A joint probability distribution for a collection of random variables
Connection between time-series and stochastic process#
A time-series can be treated as a realization (sample) of stochastic process.
Stochastic process |
Time-series |
|---|---|
Variable |
Time-stamp |
Sample |
Observations |
Example \(\to\) A Time-series with 8 time-stamps is a sample taken from joint probability distribution of a stochastic process with 8 variables.
Stationary time-series process#
First moment (\(\mathbb{E}\)) and second moment (\(V\)) should be constant over time
For all \(t\),
\(\mathbb{E}(y_t) = \mu \) Constant
\(V(y_t) = \sigma^2 \) Constant
\(Cov(y_t, y_{t+h}) = \gamma \) Constant
Why stationarity is important?#
Autoregressive models for modeling and prediction works best with stationary time-series
How to check for stationarity?#
Visually
Global v/s local test
Statistical test (Augmented Dickey-Fuller test or Unit root test)
import pandas as pd
from statsmodels.tsa.stattools import adfuller

fig, ax = plt.subplots(1,3,figsize=(15,5))
x = np.linspace(1,10,1000)
y1 = pd.read_csv('../data/international-airline-passengers.csv').values[:,1]
y2 = np.sin(x*5)+x-5
y3 = np.sin(x*5)
ax[0].plot(y1,'o-');
ax[1].plot(x,y2,'o-');
ax[2].plot(x,y3,'o-');
for each in ax[::-1]:
    each.set_xlabel('t')

ax[0].set_title(f'ADF Test p value= {np.round(adfuller(y1[:-1])[1],2)}')
ax[1].set_title(f'ADF Test p value= {np.round(adfuller(y2[:-1])[1],2)}')
ax[2].set_title(f'ADF Test p value= {np.round(adfuller(y3[:-1])[1],2)}')
each.set_ylabel('Y');
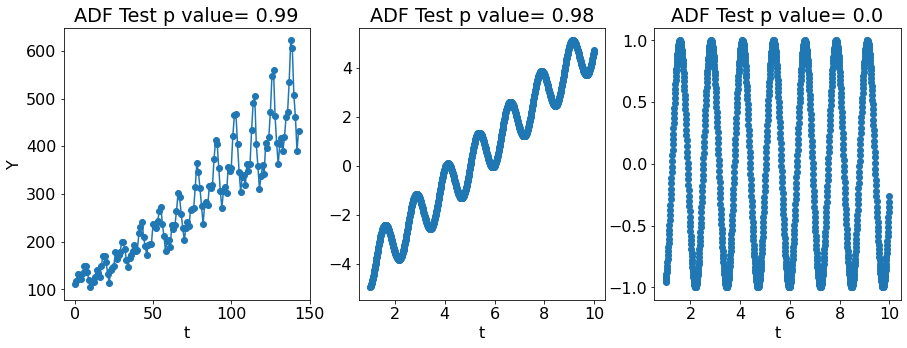
p-value close to \(1\) means non-stationarity in adfuller test and vice versa.
Linear time-series model#
Characteristic equation and unit root#
AutoRegressive(1) model
AutoRegressive(2) model
Stationarity#
if all roots are outside unit circle, we call the process as stationary
How to convert non-stationary Time-series to stationary?#
Remove known trends
Apply log transform
Take difference series
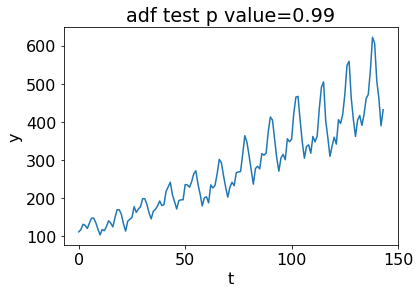
Below is an example of difference series.
plt.plot(y1);
plt.title(f'adf test p value={np.round(adfuller(y1[:-1])[1], 2)}')
plt.xlabel('t');plt.ylabel('y');
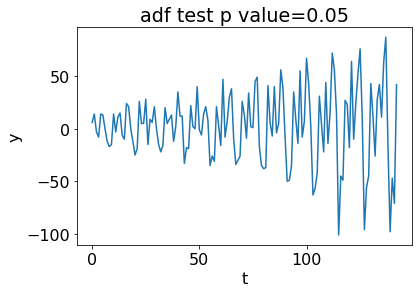
plt.figure();
y11 = y1[:-1]
y11 = y11[1:] - y11[:-1]
plt.plot(y11);
plt.title(f'adf test p value={np.round(adfuller(y11)[1], 2)}');
plt.xlabel('t');plt.ylabel('y');