Determinant#
Author: Zeel B Patel, Nipun Batra
In this notebook, we will look at determinants. https://youtu.be/Ip3X9LOh2dk
import numpy as np
import matplotlib.pyplot as plt
from matplotlib import rc

rc('font', size=16)
rc('text', usetex=True)
Transformation of N-D space#
Consider a N-D vector \(\mathbf{v}_1\). We can get a transformed N-D vector \(\mathbf{v}_1'\) by applying an appropriate linear transformation \(A\) on \(\mathbf{v}_1\).
Note that \(A\) will be a \(N \times N\) matrix here. This transformarion is given as,
1D case#
If \(\mathbf{v}_1\) is a scaler, we get transformed scaler \(\mathbf{v}_2\) by applying transformation \(A\). \(A\) would also be a scaler here.
If \(\mathbf{v}_1=3\), \(A=5\) then \(\mathbf{v}_1' = 5 \cdot 3 = 15\).
Ultimately, \(\mathbf{v}_1'\) is \(\mathbf{v}_1\) scaled by factor of \(A\).
2D case#
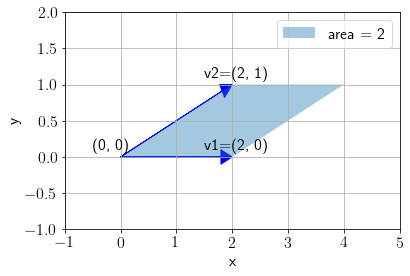
consider two vectors \(\mathbf{v}_1\) and \(\mathbf{v}_2\). We will focus on the area of the parallelogram spaned by these vectors.
def get_area(v1, v2):
    return np.abs(np.sum(np.cross(v1.ravel(), v2.ravel())))
def plot_area(v1, v2, suffix='', annotate=False, c='b'):
    vectors = [v1, v2]
    for vi, v in enumerate(vectors, 1):
        plt.arrow(x=0, y=0, dx=v[0, 0], dy=v[1, 0], shape='full',
                  head_width=0.2, head_length=0.2, length_includes_head=True, color=c)
        if annotate:
            plt.text(v[0, 0]-0.5, v[1, 0]+0.1, f'v{vi}{suffix}=({v[0, 0]}, {v[1, 0]})')

    ## Filling the area
    plt.fill([0, v1[0,0], v1[0,0]+v2[0,0], v2[0,0]],
             [0, v1[1,0], v1[1,0]+v2[1,0], v2[1,0]], alpha=0.4, label=f'area = {get_area(v1, v2)}')

    plt.text(0-0.5, 0+0.1, f'({0}, {0})')
    plt.grid()
    plt.ylim(np.min([0, v1[1,0], v2[1,0]])-1, v1[1,0]+v2[1,0]+1)
    plt.xlim(np.min([0, v1[0,0], v2[0,0]])-1, v1[0,0]+v2[0,0]+1)
    plt.xlabel('x');plt.ylabel('y');
    if annotate:
        plt.legend(bbox_to_anchor=(1,1))
vec1 = np.array([2, 0]).reshape(-1,1)
vec2 = np.array([2, 1]).reshape(-1,1)

plot_area(vec1, vec2, annotate=True)

Let us apply the following linear tranformation on \(\mathbf{v_1}\) and \(\mathbf{v_2}\).
def plot_transform(v1, v2, A, annotate=False):
    plot_area(v1, v2, annotate=annotate)
    xlim, ylim = plt.xlim(), plt.ylim()

    v1_, v2_ = A@v1, A@v2

    plot_area(v1_, v2_, suffix='\'', annotate=annotate, c='r')

    plt.xlim(min(plt.xlim()[0], xlim[0]), max(plt.xlim()[1], xlim[1]))
    plt.ylim(min(plt.ylim()[0], ylim[0]), max(plt.ylim()[1], ylim[1]))
    plt.title(f'Area should be scaled by $|A|={np.linalg.det(A)}$')
A = np.array([[2, 1], [2, 3]])

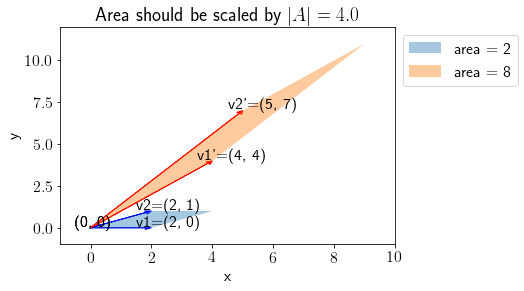
plot_transform(vec1, vec2, A, annotate=True)

Note that the area spanned by \(\mathbf{v}_1'\) and \(\mathbf{v}_2'\) is scaled by factor factor of \(|A|\) (determinant of \(A\)). More concretely,
Let us choose one more example of \(A\),
A = np.array([[2, 4], [1, 2]])

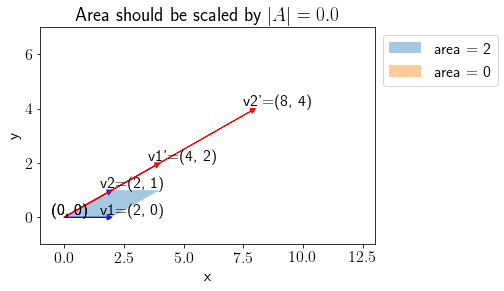
plot_transform(vec1, vec2, A, annotate=True)

Note that because \(|A|=0\), area spanned by transformed vectors is \(0\) and thus the plane spanned squeezes to a line.
For a 3D case, \(|A|\) will denote a factor by which volume spanned is scaled. This is true in general for N-D case.

