
Active Learning#
A programming introduction to query by committee strategy for active learning
Author: Nipun Batra
We all get it - AI is the new electricity. Deep neural nets are everywhere around us. But you know what, getting labelled training data can still be a big issue in many domains. This is where active learning comes in - given that we only have a small amount of labelled data, do we randomly get labels for other samples, or can we create a smarter strategy for the same? Active learning deals with the latter.
Various strategies for active learning have been proposed in the past. In this post, I’ll work out a trivial example of what is called query by committee. The key idea is that we create a committee of learners and choose to acquire labels for the unlabelled points for which there is maximum disaggrement amongst the committee.
I’d recommend the new readers to go through this survey.
In this particular post, I’d be looking at active learning via query by committee, where the committee members are trained on different subsets of the train data. In a future post, I’ll write about active learning via query by committee, where the committee members are trained on the same data, but with different parameters.
Standard imports#
import numpy as np
import matplotlib.pyplot as plt
from matplotlib import rc
import pandas as pd
import warnings
warnings.filterwarnings('ignore')
np.random.seed(0)
%matplotlib inline

rc('font', size=16)
rc('text', usetex=True)
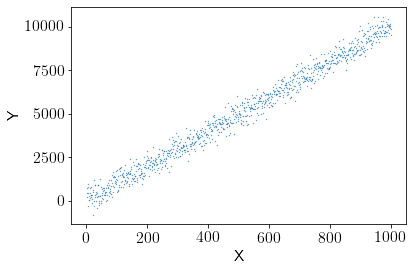
Creating dataset#
X = np.arange(1, 1001, 1)
Y = 10*X + 4 + 400* np.random.normal(size=1000)
plt.scatter(X, Y, s=0.1)
plt.xlabel("X")
plt.ylabel("Y");
Learning a linear regression model on the entire data#
from sklearn.linear_model import LinearRegression
clf = LinearRegression()
clf.fit(X.reshape(-1,1), Y)
LinearRegression()
clf.intercept_
-10.370897712970873
clf.coef_
array([9.99254389])
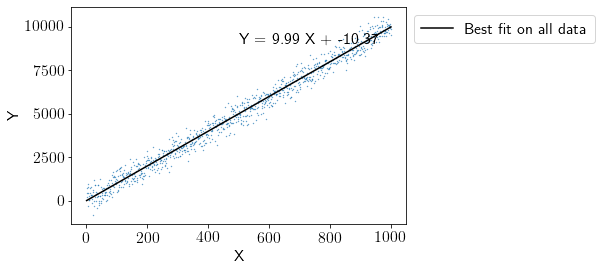
Visualising the fit#
plt.scatter(X, Y, s=0.1)
plt.xlabel("X")
plt.ylabel("Y")
plt.plot(X, clf.coef_[0]*X + clf.intercept_, color='k', label='Best fit on all data')
plt.legend(bbox_to_anchor=(1,1))
plt.text(500, clf.coef_[0]*500 + clf.intercept_ +4000, "Y = {0:0.2f} X + {1:0.2f}".format(clf.coef_[0], clf.intercept_) );
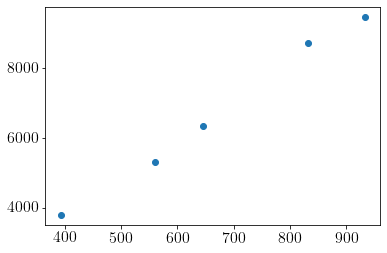
Creating the initial train set, the test set and the pool#
from sklearn.model_selection import train_test_split
train_pool_X, test_X, train_pool_Y, test_Y = train_test_split(X, Y, test_size = 0.5)
train_X, pool_X, train_Y, pool_Y = train_test_split(train_pool_X, train_pool_Y, test_size=495)
plt.scatter(train_X, train_Y);
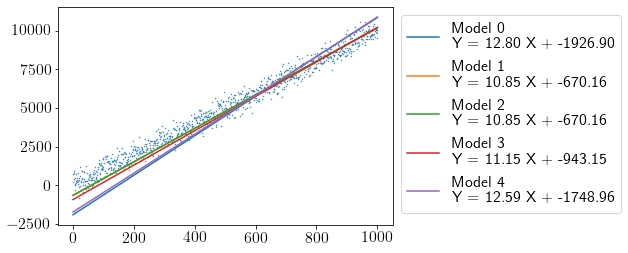
Creating a committee each learnt on different subset of the data#
committee_size = 5
train_X_com = {0:{}}
train_Y_com = {0:{}}
models_com = {0:{}}

iteration = 0

for cur_committee in range(committee_size):
    train_X_com[iteration][cur_committee], _, train_Y_com[iteration][cur_committee], _ = train_test_split(train_X, train_Y, train_size=0.5,
                                                                              random_state=cur_committee)
    models_com[iteration][cur_committee] = LinearRegression()
    models_com[iteration][cur_committee].fit(train_X_com[iteration][cur_committee].reshape(-1,1), train_Y_com[iteration][cur_committee])
Plotting the fit of the committee on the entire dataset#
plt.scatter(X, Y, s=0.2)
for cur_committee in range(committee_size):
    plt.plot(X, models_com[0][cur_committee].coef_[0]*X + models_com[0][cur_committee].intercept_,
             label='Model {0}\nY = {1:0.2f} X + {2:0.2f}'.format(cur_committee,
                                                                 models_com[0][cur_committee].coef_[0],
                                                                models_com[0][cur_committee].intercept_))
    plt.legend(bbox_to_anchor=(1,1))
Evaluate the performance on the test set#
estimations_com = {0:{}}
for cur_committee in range(committee_size):
    estimations_com[0][cur_committee] = models_com[0][cur_committee].predict(test_X.reshape(-1, 1))
test_mae_error = {0:(pd.DataFrame(estimations_com[0]).mean(axis=1) - test_Y).abs().mean()}
The MAE on the test set is:
test_mae_error[0]
565.8837967341798
Active learning procedure#
num_iterations = 20
points_added_x=[]

points_added_y=[]

print("Iteration, Cost\n")
print("-"*40)

for iteration in range(1, num_iterations):
    # For each committee: making predictions on the pool set based on model learnt in the respective train set
    estimations_pool = {cur_committee: models_com[iteration-1][cur_committee].predict(pool_X.reshape(-1, 1)) for cur_committee in range(committee_size)}
    # Finding points from the pool with highest disagreement among the committee - highest standard deviation
    in_var = pd.DataFrame(estimations_pool).std(axis=1).argmax()

    to_add_x = pool_X[in_var]
    to_add_y = pool_Y[in_var]
    points_added_x.append(to_add_x)
    points_added_y.append(to_add_y)

    # For each committee - Adding the point where the committe most disagrees
    for com in range(committee_size):
        if iteration not in train_X_com:
            train_X_com[iteration] = {}
            train_Y_com[iteration] = {}
            models_com[iteration] = {}
        train_X_com[iteration][com] = np.append(train_X_com[iteration-1][com], to_add_x)
        train_Y_com[iteration][com] = np.append(train_Y_com[iteration-1][com], to_add_y)

    # Deleting the point from the pool
    pool_X = np.delete(pool_X, in_var)
    pool_Y = np.delete(pool_Y, in_var)

    # Training on the new set for each committee
    for cur_committee in range(committee_size):
        models_com[iteration][cur_committee] = LinearRegression()
        models_com[iteration][cur_committee].fit(train_X_com[iteration][cur_committee].reshape(-1,1), train_Y_com[iteration][cur_committee])

    estimations_com[iteration] = {}
    for cur_committee in range(committee_size):
        estimations_com[iteration][cur_committee] = models_com[iteration][cur_committee].predict(test_X.reshape(-1, 1))
    test_mae_error[iteration]=(pd.DataFrame(estimations_com[iteration]).mean(axis=1) - test_Y).abs().mean()
    print(iteration, (test_mae_error[iteration]))
Iteration, Cost

----------------------------------------
1 406.17664898054875
2 402.9897752715986
3 348.4518273905421
4 348.49519515039907
5 349.0419793847571
6 348.68188577804807
7 352.40882668573255
8 373.60417208279847
9 377.25044571705723
10 372.5302143045216
11 335.30243056115603
12 336.6073606660666
13 343.2867837998923
14 347.04912663733046
15 349.7464195274436
16 351.5990833631039
17 349.21957548034965
18 338.87652232064744
19 337.0132510959355
pd.Series(test_mae_error).plot(style='ko-')
plt.xlim((-0.5, num_iterations+0.5))
plt.ylabel("MAE on test set")
plt.xlabel("\# Points Queried");
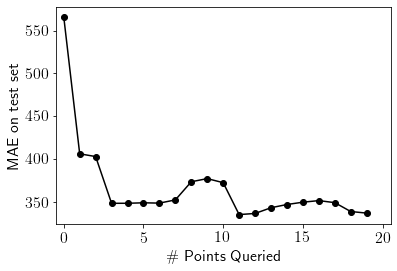
As expected, the error goes down as we increase the number of points queried
fig, ax = plt.subplots(figsize=(10,5))
import os
from matplotlib.animation import FuncAnimation
plt.rcParams['animation.ffmpeg_path'] = os.path.expanduser('/Users/nipun/ffmpeg')
def update(iteration):
    ax.cla()
    ax.scatter(X, Y, s=0.2)
    ax.set_title("Iteration: {} \n MAE = {:0.2f}".format(iteration, test_mae_error[iteration]))
    for cur_committee in range(committee_size):
        ax.plot(X, models_com[iteration][cur_committee].coef_[0]*X + models_com[iteration][cur_committee].intercept_,
             label='Model {0}\nY = {1:0.2f} X + {2:0.2f}'.format(cur_committee,
                                                                 models_com[iteration][cur_committee].coef_[0],
                                                                models_com[iteration][cur_committee].intercept_))

        ax.scatter(points_added_x[iteration], points_added_y[iteration],s=100, color='red')
    ax.legend(bbox_to_anchor=(1,1))
    ax.set_xlabel('x')
    ax.set_ylabel('y')
    fig.tight_layout()

plt.close()
anim = FuncAnimation(fig, update, frames=np.arange(0, num_iterations-1, 1), interval=1000)
rc('animation', html='jshtml')
anim
From the animation, we can see that how adding a new point to the train set (shown in red) reduces the variation in prediction amongst the different committee members.