Query by Committee
Contents
Query by Committee
# Common imports
import numpy as np
import matplotlib.pyplot as plt
from matplotlib.animation import FuncAnimation
from matplotlib import rc
plt.style.use('fivethirtyeight')
rc('animation', html='jshtml')
# Copy the models
from copy import deepcopy
# Sklearn imports
from sklearn.ensemble import RandomForestRegressor, RandomForestClassifier
from sklearn.datasets import make_classification
from sklearn.model_selection import train_test_split
from sklearn.metrics import accuracy_score, f1_score
# Entropy function
from scipy.stats import entropy
# Progress helper
from IPython.display import clear_output
QBC by posterior sampling
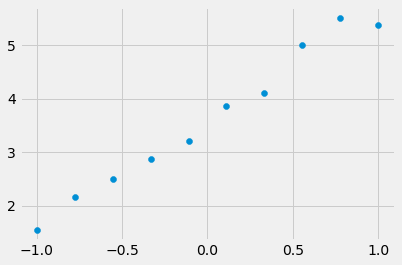
An example: Bayesian linear regression
np.random.seed(0)
N = 10
X = np.linspace(-1,1,N).reshape(-1,1)
t0 = 3
t1 = 2
y = X * t1 + t0 + np.random.rand(N,1)
plt.scatter(X, y);
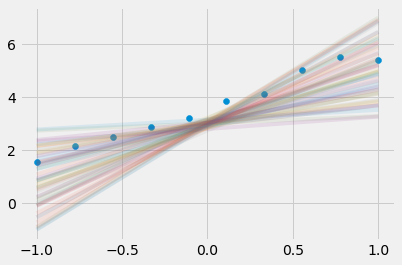
Assume a posterior
n_samples = 50
t0_dist_samples = np.random.normal(t0, 0.1, size=n_samples)
t1_dist_samples = np.random.normal(t1, 1, size=n_samples)
Plot the models
plt.scatter(X, y)
for i in range(len(t0_dist_samples)):
sample_t0 = t0_dist_samples[i]
sample_t1 = t1_dist_samples[i]
plt.plot(X, X * sample_t1 + sample_t0,alpha=0.1)
QBC by bootstrapping
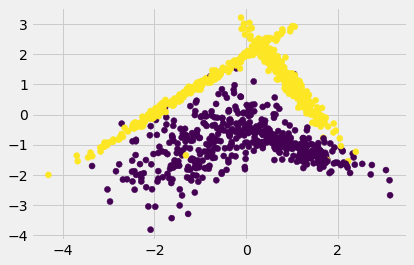
2 class dataset
X, y = make_classification(n_samples=1000, n_features=2, n_informative=2, n_redundant=0, random_state=3, shuffle=True)
plt.figure()
plt.scatter(X[:,0], X[:,1], c=y);
Full data fit with RF
model = RandomForestClassifier(random_state=0)
model.fit(X, y);
RandomForestClassifier(random_state=0)
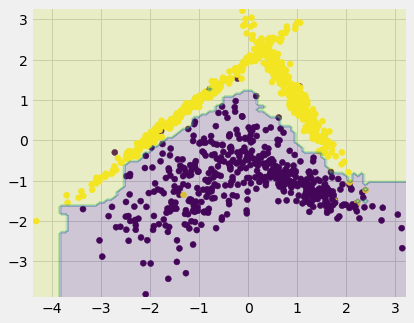
Visualize decision boundary
grid_X1, grid_X2 = np.meshgrid(np.linspace(X[:,0].min()-0.1, X[:,0].max()+0.1, 100),
np.linspace(X[:,1].min()-0.1, X[:,1].max()+0.1, 100))
grid_X = [(x1, x2) for x1, x2 in zip(grid_X1.ravel(), grid_X2.ravel())]
grid_pred = model.predict(grid_X)
plt.figure(figsize=(6,5))
plt.scatter(X[:,0], X[:,1], c=y);
plt.contourf(grid_X1, grid_X2, grid_pred.reshape(*grid_X1.shape), alpha=0.2);
Train, pool, test split
X_train_pool, X_test, y_train_pool, y_test = train_test_split(X, y, test_size=0.2, random_state=0, stratify=y)
X_train, X_pool, y_train, y_pool = train_test_split(X_train_pool, y_train_pool, train_size=20, random_state=0)
X_list = [X_train, X_pool, X_test]
y_list = [y_train, y_pool, y_test]
t_list = ['Train', 'Pool', 'Test']
fig, ax = plt.subplots(1,3,figsize=(15,4), sharex=True, sharey=True)
for i in range(3):
ax[i].scatter(X_list[i][:,0], X_list[i][:,1], c=y_list[i])
ax[i].set_title(t_list[i])

Fitting a model on initial train data
AL_model = RandomForestClassifier(n_jobs=28, random_state=0)
AL_model.fit(X_train, y_train);
RandomForestClassifier(n_jobs=28, random_state=0)
Get the votes from trees on pool dataset
votes = np.zeros(shape=(X_pool.shape[0], len(AL_model.estimators_)))
for learner_idx, learner in enumerate(AL_model.estimators_):
votes[:, learner_idx] = learner.predict(X_pool)
votes.shape
(780, 100)
votes
array([[0., 0., 0., ..., 0., 0., 0.],
[0., 0., 0., ..., 0., 0., 0.],
[1., 1., 1., ..., 0., 1., 1.],
...,
[0., 0., 0., ..., 0., 0., 0.],
[0., 0., 0., ..., 0., 0., 0.],
[0., 0., 0., ..., 0., 0., 0.]])
Convert to probabilities
p_vote = np.zeros(shape=(X_pool.shape[0], X_pool.shape[1]))
for vote_idx, vote in enumerate(votes):
vote_counter = {0 : (1-vote).sum(), 1 : vote.sum()}
for class_idx, class_label in enumerate(range(X.shape[1])):
p_vote[vote_idx, class_idx] = vote_counter[class_label]/len(AL_model.estimators_)
p_vote
array([[1. , 0. ],
[0.89, 0.11],
[0.06, 0.94],
...,
[0.93, 0.07],
[1. , 0. ],
[1. , 0. ]])
Calculate dissimilarity (entropy)
example_id = 2
ans = 0
for category in range(X_pool.shape[1]):
ans += (-p_vote[example_id][category] * np.log(p_vote[example_id][category]))
ans
0.22696752250060448
entr = entropy(p_vote, axis=1)
entr[example_id]
0.22696752250060448
Active Learning Flow
def get_query_idx():
# Gather the votes
votes = np.zeros(shape=(X_pool.shape[0], len(AL_model.estimators_)))
for learner_idx, learner in enumerate(AL_model.estimators_):
votes[:, learner_idx] = learner.predict(X_pool)
# Calcuate probability of votes
p_vote = np.zeros(shape=(X_pool.shape[0], X_pool.shape[1]))
for vote_idx, vote in enumerate(votes):
vote_counter = {0 : (1-vote).sum(),
1 : vote.sum()}
for class_idx, class_label in enumerate(range(X.shape[1])):
p_vote[vote_idx, class_idx] = vote_counter[class_label]/len(AL_model.estimators_)
# Calculate entropy for each example
entr = entropy(p_vote, axis=1)
# Choose example with highest entropy (disagreement)
return entr.argmax()
Prepare data for random sampling
X_train_rand = X_train.copy()
y_train_rand = y_train.copy()
X_pool_rand = X_pool.copy()
y_pool_rand = y_pool.copy()
random_model = RandomForestClassifier(n_jobs=28, random_state=0)
Run active learning
AL_iters = 100
np.random.seed(0)
AL_inds = []
AL_models = []
random_inds = []
random_models = []
for iteration in range(AL_iters):
clear_output(wait=True)
print("iteration", iteration)
######## Active Learning ############
# Fit the model
AL_model.fit(X_train, y_train)
AL_models.append(deepcopy(AL_model))
# Query a point
query_idx = get_query_idx()
AL_inds.append(query_idx)
# Add it to the train data
X_train = np.concatenate([X_train, X_pool[query_idx:query_idx+1, :]], axis=0)
y_train = np.concatenate([y_train, y_pool[query_idx:query_idx+1]], axis=0)
# Remove it from the pool data
X_pool = np.delete(X_pool, query_idx, axis=0)
y_pool = np.delete(y_pool, query_idx, axis=0)
######## Random Sampling ############
# Fit the model
random_model.fit(X_train_rand, y_train_rand)
random_models.append(deepcopy(random_model))
# Query a point
query_idx = np.random.choice(len(X_pool))
random_inds.append(query_idx)
# Add it to the train data
X_train_rand = np.concatenate([X_train_rand, X_pool_rand[query_idx:query_idx+1, :]], axis=0)
y_train_rand = np.concatenate([y_train_rand, y_pool_rand[query_idx:query_idx+1]], axis=0)
# Remove it from the pool data
X_pool_rand = np.delete(X_pool_rand, query_idx, axis=0)
y_pool_rand = np.delete(y_pool_rand, query_idx, axis=0)
iteration 99
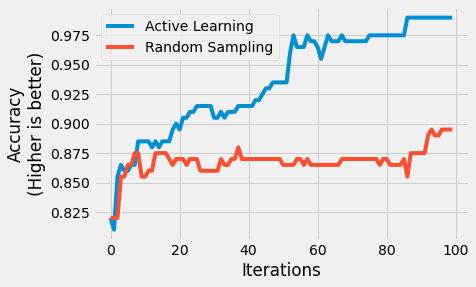
Plot accuracy
random_scores = []
AL_scores = []
for iteration in range(AL_iters):
clear_output(wait=True)
print("iteration", iteration)
AL_scores.append(accuracy_score(y_test, AL_models[iteration].predict(X_test)))
random_scores.append(accuracy_score(y_test, random_models[iteration].predict(X_test)))
plt.plot(AL_scores, label='Active Learning');
plt.plot(random_scores, label='Random Sampling');
plt.legend();
plt.xlabel('Iterations');
plt.ylabel('Accuracy\n(Higher is better)');
iteration 99
Plot decision boundary
def update(i):
for each in ax:
each.cla()
AL_grid_preds = AL_models[i].predict(grid_X)
random_grid_preds = random_models[i].predict(grid_X)
# Active learning
ax[0].scatter(X_train[:n_train,0], X_train[:n_train,1], c=y_train[:n_train], label='initial_train', alpha=0.2)
ax[0].scatter(X_train[n_train:n_train+i, 0], X_train[n_train:n_train+i, 1],
c=y_train[n_train:n_train+i], label='new_points')
ax[0].contourf(grid_X1, grid_X2, AL_grid_preds.reshape(*grid_X1.shape), alpha=0.2);
ax[0].set_title('New points')
ax[1].scatter(X_test[:, 0], X_test[:, 1], c=y_test, label='test_set')
ax[1].contourf(grid_X1, grid_X2, AL_grid_preds.reshape(*grid_X1.shape), alpha=0.2);
ax[1].set_title('Test points');
ax[0].text(locs[0],locs[1],'Active Learning')
# Random sampling
ax[2].scatter(X_train_rand[:n_train,0], X_train_rand[:n_train,1], c=y_train_rand[:n_train], label='initial_train', alpha=0.2)
ax[2].scatter(X_train_rand[n_train:n_train+i, 0], X_train_rand[n_train:n_train+i, 1],
c=y_train_rand[n_train:n_train+i], label='new_points')
ax[2].contourf(grid_X1, grid_X2, random_grid_preds.reshape(*grid_X1.shape), alpha=0.2);
ax[2].set_title('New points')
ax[3].scatter(X_test[:, 0], X_test[:, 1], c=y_test, label='test_set')
ax[3].contourf(grid_X1, grid_X2, random_grid_preds.reshape(*grid_X1.shape), alpha=0.2);
ax[3].set_title('Test points');
ax[2].text(locs[0],locs[1],'Random Sampling');
locs = (2.7, 4)
fig, ax = plt.subplots(2,2,figsize=(12,6), sharex=True, sharey=True)
ax = ax.ravel()
n_train = X_train.shape[0]-AL_iters
anim = FuncAnimation(fig, func=update, frames=range(100))
plt.close()
anim
